
THE TRILLION-DOLLAR FOOD PIPELINE
Part II: The Companies Behind the Cargo
The businesses that move the world’s food do not all make money the same way. Some earn thin spreads on enormous commodity transactions. Others collect fees for access to railroads, rivers and terminals. A growing number are backed by governments. Their financial statements reveal how differently each participates in the same global trade, and where private contracts keep the answers out of view.
In 2025, ADM reported $80.3 billion in revenue. It spent $75.2 billion of that on the cost of the products it sold. After operating expenses, interest, impairments and taxes, the company kept $1.08 billion in net earnings, about 1.3 cents for every dollar of sales.
That same year, Rumo, the railroad that carries much of Mato Grosso’s grain to the Port of Santos, reported R$13.8 billion in net revenue. Its adjusted earnings before interest, taxes, depreciation and amortization, or EBITDA, came to R$8.0 billion, a margin of 57.9 percent.
Set side by side, the two numbers suggest that railroads are vastly more profitable than grain merchants. They are not evidence of that. The figures measure different things, on different revenue bases, for businesses that require entirely different kinds of capital.
Understanding why is the key to understanding who earns money in the global food trade.
The companies moving the world’s food do not compete for the same profit. They earn it through different mechanisms: trading spreads, processing margins, transportation fees, capacity commitments and returns on infrastructure investment.
The Merchants: Enormous Revenue, Narrow Spreads
The large agricultural merchants report revenue figures that rival national economies. Most of that revenue is the value of the commodities themselves.
When a merchant buys soybeans from a farmer and sells them to a crusher in China, it records the full sale price as revenue. Its profit is the small difference between what it paid and what it received, after freight, storage, financing, hedging and overhead.
The 2025 results of the publicly reporting merchants show how thin that difference is:
| Company | 2025 revenue | 2025 net income | Net margin |
|---|---|---|---|
| ADM | $80.3 billion | $1.08 billion | 1.3% |
| Bunge | $70.3 billion | $816 million | 1.2% |
| Louis Dreyfus Company | $53.2 billion | $653 million | 1.2% |
Two of the world’s largest merchants cannot be placed in that table:
- Cargill, the largest privately held company in the United States, reported revenue of $164 billion for its fiscal year ended May 2026. It does not publish full financial statements, so its profit is not public.
- COFCO International, the trading arm of China’s state food group, reported 2025 revenue of $34.5 billion, down from $38.5 billion, on lower third-party volumes. It did not disclose net income in that report.
What does a merchant actually earn from? ADM’s segment disclosures offer the clearest answer available:
| ADM business | 2025 operating profit | 2024 operating profit |
|---|---|---|
| Ag Services (origination, merchandising, transportation, storage) | $636 million | $715 million |
| Crushing (soybeans into meal and oil) | $159 million | $844 million |
ADM attributed the merchandising decline to lower North American soybean exports and disrupted international trade flows. Farmers held back sales, and customers kept smaller inventories, leaving fewer trading opportunities.
That explanation reveals the merchant business model. Merchants profit from movement and from price differences across locations and time. When trade flows slow or margins compress, earnings fall even if the company remains enormous.
Louis Dreyfus Company demonstrated the same principle from the opposite direction. Its shipped volumes rose 10.6 percent in 2025, yet net income fell from $726 million to $653 million as average commodity prices declined. Bunge completed its combination with Viterra during the year, substantially expanding its grain network. Its net income still declined from $1.14 billion to $816 million.
More tonnage did not guarantee more profit.
The merchant model also requires large amounts of capital that never appear in a margin calculation. At the end of 2025, ADM held $7.9 billion in operating working capital, much of it inventory and receivables, plus $11.2 billion in property, plant and equipment. Its return on invested capital was 4.5 percent, or 6.3 percent on the company’s adjusted basis.
The Toll Collectors: High Margins, Heavy Commitments
Infrastructure companies earn money differently. A railroad or barge operator does not usually buy the soybeans it carries. Its revenue is the fee for moving them. Because that fee is not inflated by the value of the cargo, its margins appear far higher.
Rumo’s North Operation, which includes the Mato Grosso and São Paulo networks carrying grain toward Santos, reported a 62.2 percent adjusted EBITDA margin in 2025.
EBITDA, however, is measured before two charges that weigh heavily on infrastructure businesses: depreciation of track and rolling stock, and interest on the debt that financed them. It also says nothing about the cash a railroad must keep investing to maintain and expand capacity.
That investment is not recorded as an expense when it is made. It appears as capital expenditure in the cash flow statement and reaches the income statement gradually, through depreciation, over the life of the assets.
Below the EBITDA line, and in the cash flow statement, Rumo’s picture changes:
| Rumo, 2025 | |
|---|---|
| Net income | R$865 million (6.2% net margin), after a R$1.2 billion impairment on its southern network |
| Adjusted net income | R$2.1 billion, excluding that charge |
| Capital expenditure | R$6.1 billion of cash invested in 2025, equal to roughly three-quarters of its adjusted EBITDA |
| Net debt | R$15.5 billion at year-end |
Part I described how Rumo reduced prices in 2025 to defend market share against competing export corridors. Even a dominant railroad does not set prices without constraint.
Hidrovias do Brasil, which operates barges and terminals on the Tapajós River corridor leading north from Mato Grosso, offers an even sharper lesson:
- The corridor: In 2025, its Northern Corridor generated R$1.1 billion in revenue and R$662 million in recurring adjusted EBITDA, a 60 percent margin.
- The company: The consolidated company recorded a net loss of R$141 million for the year, largely reflecting the write-off of a coastal shipping business it sold in November. Its continuing operations earned R$61 million.
- The drought: A severe drought in 2024 reduced river levels in both of its main corridors. In the fourth quarter of 2024, Northern Corridor recurring EBITDA was negative. By year-end, the company’s leverage had reached 7.0 times EBITDA.
- The recovery: Leverage fell to 2.3 times by the end of 2025, after operations recovered and Brazilian fuel and infrastructure group Ultrapar became controlling shareholder with a capital injection.
A business can report a 60 percent EBITDA margin in one segment and still lose money as a company.
An infrastructure asset can generate dependable fees when it operates. But it cannot relocate when a river falls or a railway floods, and the debt that built it must be serviced either way.
Why the Margins Cannot Be Compared Directly
The contrast between ADM’s 1.3 percent net margin and Rumo’s 57.9 percent EBITDA margin illustrates different business models, not relative profitability.
Absolute numbers help. At the 2025 average exchange rate of about R$5.59 per dollar, Rumo’s revenue equaled roughly US$2.5 billion and its adjusted EBITDA roughly US$1.4 billion. That EBITDA approached Louis Dreyfus Company’s $1.83 billion on less than one-twentieth of LDC’s revenue.
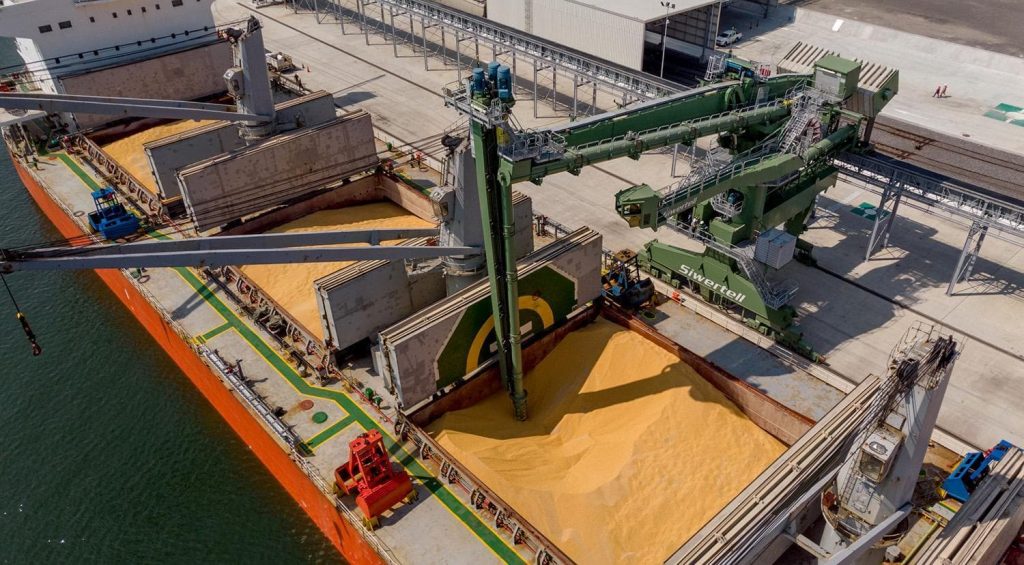
Even that comparison overstates the case. Rumo’s earnings depend on rail assets that must be continually replaced and expanded, largely with borrowed money. A merchant’s capital is concentrated in inventory, receivables and processing plants that turn over or can be redeployed.
The appropriate test is return on invested capital: how much profit a business generates relative to all the money committed to it. Comparable figures are not published across every company in this investigation:
- Published: ADM’s adjusted return was 6.3 percent in 2025, and Maersk’s terminal business reported 16.1 percent.
- Not published: Rumo, Hidrovias, Bunge and Louis Dreyfus do not publish the measure on a basis that permits direct comparison, and estimating it from partial data would be misleading.
What the evidence supports is narrower and more useful. Merchants earn volatile spreads on large transactions. Infrastructure operators earn high operating margins that must cover heavy fixed investment, debt and operational risk. Neither model is automatically superior. Each carries a different kind of exposure.
Ships That Carry and Terminals That Charge
Ocean shipping adds a third business model.
Star Bulk Carriers, one of the largest listed owners of dry-bulk vessels, the ships that carry grain, iron ore and coal, shows how volatile it can be:
- Net income: $84.2 million in 2025, down from $304.7 million in 2024.
- Daily earnings: In the fourth quarter, its ships earned an average of $19,012 a day on a time-charter-equivalent basis.
- Daily cash margin: After operating and cash administrative costs of about $6,444 a day, roughly $12,570 per vessel remained before debt service and capital spending.
A shipowner’s income depends on charter rates set in a cyclical global market, against fixed costs for vessels and crews. Grain traders frequently charter ships rather than own them. A charterer and an owner can therefore experience the same freight cycle in opposite directions. Whether any trader profited from freight positions in 2025 or 2026 has not been disclosed.
A comparison from container shipping shows the difference between operating vessels and operating the infrastructure ships depend on. Container lines carry manufactured goods far more than bulk grain, so this is a comparison of business models, not of the soybean trade.
| Maersk division, 2025 | Revenue | EBIT | EBIT margin | Invested capital |
|---|---|---|---|---|
| Ocean shipping | $35.0 billion | $1.39 billion | about 4% | $32.6 billion |
| Terminals | $5.3 billion | $1.75 billion | about 33% | $9.3 billion |
The terminal business earned more operating profit than the shipping business on about 15 percent of the revenue and less than a third of the invested capital. In the fourth quarter, ocean operating profit turned negative as average freight rates fell 23 percent, even though loaded volumes rose 8 percent. The terminals division reported a 16.1 percent return on invested capital.
The terminal business earned more operating profit than the shipping business on about 15 percent of the revenue and less than a third of the invested capital.
The State Investors
The fourth business model belongs to governments, or to companies they control.
In April 2026, Olam Group completed the sale of a 44.58 percent stake in Olam Agri to the Saudi Agricultural and Livestock Investment Company, SALIC. SALIC is the food and agriculture investment arm of Saudi Arabia’s Public Investment Fund. The transaction terms:
- Price: about $1.88 billion for the stake.
- Implied value: $4.0 billion for 100 percent of Olam Agri.
- Resulting ownership: SALIC now holds 80.01 percent.
- Remaining stake: Olam Group retains the other 19.99 percent, with an option to sell it to SALIC on the third anniversary of the April 2026 closing. The price would be about $799.6 million plus additional consideration and a 6 percent annual return. Olam has described the option as providing certainty that the second sale will be completed. Until that sale takes place, SALIC owns 80.01 percent. Full ownership would follow only if the option is exercised and the transaction closes.
China’s investments described in Part I follow a different pattern. COFCO International’s 2025 revenue fell, but its parent’s state-backed trading arm has committed capital to physical assets in Brazil. It owns 979 rail wagons and 23 locomotives operated by Rumo, and it runs its own export terminal at the Port of Santos.
These transactions establish ownership and contractual access. They do not establish preferential supply. No public contract reviewed for this investigation shows that Olam Agri’s commodities, or COFCO’s Brazilian capacity, are reserved for Saudi or Chinese buyers ahead of other customers.
What the investments do show is a strategic choice. Major importing nations are acquiring positions inside the merchant and infrastructure businesses that organize international trade, rather than relying only on purchasing from them.
What the Financial Statements Reveal
Brought together, the disclosures describe a layered industry rather than a single market:
| Participant | How it earns | Main exposure |
|---|---|---|
| Merchants | Margins near 1 percent on the largest revenue | Trade flows, price differences and timing |
| Processors | Spreads that can collapse within a year, as ADM’s 81 percent drop in crushing profit showed | Processing margins |
| Railroads and barge operators | High operating margins | Heavy investment, debt and weather |
| Shipowners | Charter rates | Freight cycles they do not control |
| Terminal operators | Strong returns from controlling points every cargo must pass through | Utilization and investment requirements |
| State-backed investors | Positions in all of these layers | Reasons that extend beyond annual profit |
The public record has limits. Cargill and COFCO International do not publish full profit statements. Freight contracts, terminal capacity agreements and rail rates negotiated with individual traders remain private. The financial statements show where money is earned in aggregate. They rarely show the earnings attached to a single cargo.
The Next Leg of the Journey
Every business in this investigation shares one dependency. Their earnings assume that cargo can move from origin to destination along predictable routes, at predictable cost.
That assumption is most fragile at sea. Grain bound for Asia, the Middle East and Europe must pass through a small number of canals and straits. When one of them is restricted by drought, conflict or congestion, voyages lengthen, freight and insurance costs rise, and the economics of every participant described here shift at once.
Which waterways carry the world’s agricultural trade? What does passage through them cost? And who bears the financial consequences when they close?
That is where Part III, The World’s Most Expensive Waterways, begins. To read Part I, [click here]
Sources
Primary sources
- ADM — Fourth Quarter and Full-Year 2025 Results, Form 8-K Exhibit 99.1 (February 3, 2026): https://www.sec.gov/Archives/edgar/data/7084/000000708426000005/adm-ex991_20251231xq4.htm
- Bunge Global SA — Fourth Quarter and Full-Year 2025 Results (February 4, 2026): https://investors.bunge.com/~/media/Files/B/Bunge-IR/documents/financial-information/press-releases/q4-2025-earnings-release.pdf
- Bunge Global SA — Form 10-K for 2025: https://www.sec.gov/Archives/edgar/data/1996862/000162828026009842/bg-20251231.htm
- Louis Dreyfus Company — 2025 Results (March 18, 2026): https://www.ldc.com/?p=40049
- Rumo S.A. — 4Q25 Results Report (March 4, 2026): https://api.mziq.com/mzfilemanager/v2/d/003f6029-d45a-44ac-9c9e-869fe5df83fc/60f1105f-0223-48ab-1f7c-4a41defe85f8?origin=2
- Hidrovias do Brasil — 4Q25 Results (March 2, 2026): https://api.mziq.com/mzfilemanager/v2/d/c8024f4a-80c2-4b44-ac23-8a7aa499da81/1557de7a-6d2b-ba00-9ba3-c4f0bbe1bdef?origin=2
- Star Bulk Carriers — Fourth Quarter and Full-Year 2025 Results (February 2026): https://www.starbulk.com/media/uploads_file/2026/02/25/p1jiba9it01nrj1nio10561udncgg4.pdf
- A.P. Møller-Mærsk — Q4 and FY 2025 Investor Presentation (February 2026): https://investor.maersk.com/static-files/09656450-cff1-4471-88ec-f07a1f43bf1c
- Olam Group — Completion of 44.58% Stake Sale in Olam Agri to SALIC (April 27, 2026): https://www.olamgroup.com/content/dam/olamgroup/news-press-releases/press-release-pdfs/27apr2026-olam-agri-sale-news-release.pdf
- Rumo S.A. — COFCO International rail equipment investment announcement (January 27, 2025): https://www.rumolog.com/sala-de-imprensa/cofco-international-investe-r-12-bilhao-na-compra-de-vagoes-e-locomotivas-em-operacao-com-a-rumo/
- COFCO International — Santos port terminal construction announcement (August 14, 2023): https://www.cofcointernational.com/newsroom/cofco-international-starts-construction-on-santos-port-terminal-expansion/
Secondary reporting
- Reuters via Stockopedia — COFCO International 2025 revenue and volumes (June 24, 2026): https://www.stockopedia.com/share-prices/china-foods-HKG:506/news/crop-trader-cofco-international-apos-s-sales-fall-further-in-2025-019efa77-f779-7440-aa50-d9d332877212/
- World Grain — Cargill fiscal 2026 revenue (August 2026): https://www.world-grain.com/articles/23071-cargill-revenue-grows-amid-shifting-food-landscape
- Star Tribune — Cargill financial disclosure practices (August 13, 2024): https://www.startribune.com/article/601102665