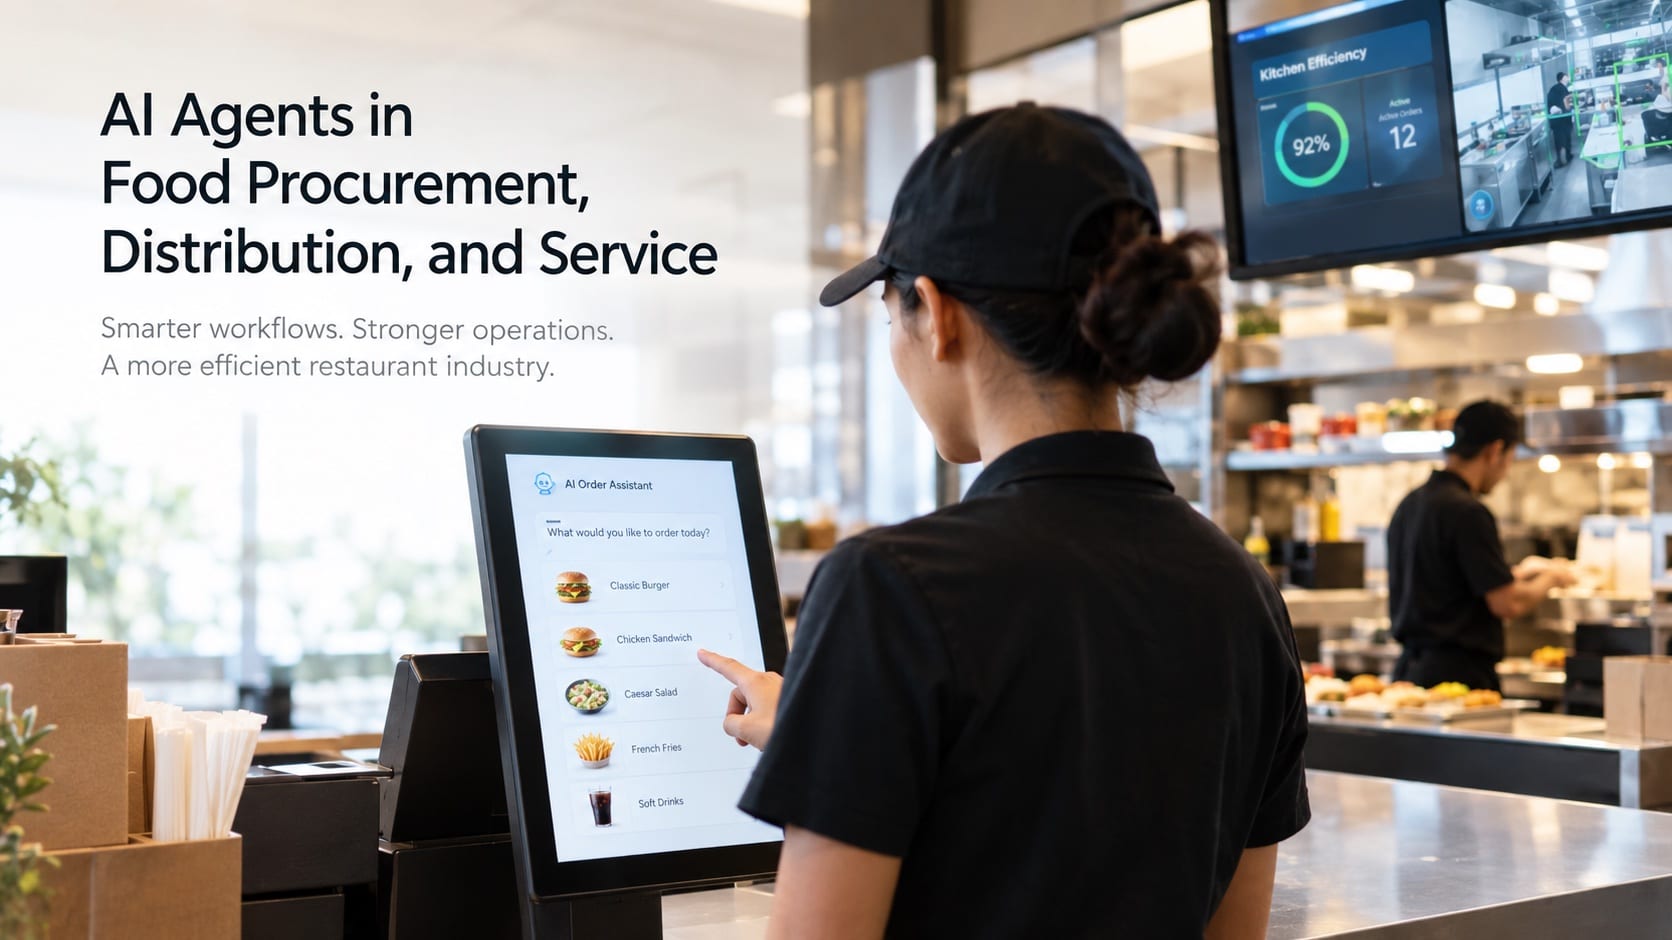

What productivity research, labor projections, and early deployments show about workflows, staffing, and operational control across the restaurant industry.
The restaurant industry is growing. The work inside it is being reorganized.
The National Restaurant Association’s 2026 State of the Restaurant Industry report projects $1.55 trillion in restaurant and foodservice sales and more than 100,000 additional jobs this year. The same report names rising costs as the industry’s key stressor, and says those costs are limiting operator margins. It forecasts real sales growth of only 1.3 percent and expects open positions to be hard to fill.
Those conditions create the incentive. Sales are rising slowly, costs are not, and labor is difficult to hire. Operators have every reason to reduce the human time required per order, per shift, and per location.
AI agents are being built to do exactly that. They will not arrive as a single replacement event.
This article organizes their effect into five layers: ordering, administration, purchasing, staffing, and the work that remains. The layers are an analytical framework, not a verified sequence. In practice, several can automate at the same time. What they share is that agents reach the most digital, repetitive, and clearly defined work before anything else.
Layer One: The Order
The first transaction in any restaurant is the order, and it is one of the most exposed to automation.
On March 18, 2025, Yum! Brands announced a collaboration with NVIDIA. The collaboration covers three areas:
- voice order-taking agents for drive-through and call-center operations
- computer vision for drive-through efficiency and back-of-house labor management
- AI-driven analytics that generate action plans for restaurant managers
Yum! said it planned to roll the technology out to 500 Taco Bell, Pizza Hut, KFC, and Habit Burger restaurants in the second quarter of 2025.
These agents do not advise an employee. They perform the function. They interpret a customer’s request against an actual menu and move the order into an operational system.
Federal labor projections already reflect the shift. The Bureau of Labor Statistics projects waiter and waitress employment to grow only 2 percent from 2025 to 2035, below the 3 percent average for all occupations. BLS attributes the reduced need partly to self-service ordering kiosks and to carryout.
Automating the order does not automate the meal. Someone still prepares, checks, packages, and hands it over.
The staffing effect depends on what the operator does with the freed time. An employee who took orders can be reassigned to other duties, or the operator can remove the shift position altogether.
Automation can move the bottleneck without removing it. But once the order is digital from the first word, everything behind it can be connected.
Layer Two: The Back Office
The second layer sits out of the guest’s sight.
Every restaurant generates administrative work: schedules, invoices, payroll records, product updates, catering documents, and recurring reports. Most of it already lives in software, and agents are designed to operate inside software.
McKinsey and EuroCommerce’s State of Grocery Retail Europe 2026 estimates that AI agents could automate 40 to 50 percent of routine activities in grocery headquarters. That figure describes grocery, not restaurants. The underlying work is shared across food businesses, though: entering orders, reconciling invoices, managing supplier delays, and maintaining product records.
BLS projections show the same direction across the economy. The occupations with the largest projected job declines from 2025 to 2035 include general office clerks, down 6.0 percent, and customer-service representatives, down 5.3 percent. Among the fastest-declining occupations are order clerks, down 17.5 percent, and payroll and timekeeping clerks, down 15.9 percent.
These are national projections across all industries, shaped by multiple forces over ten years. They cannot be converted directly into restaurant displacement rates. They do show which kinds of work the labor market expects to need less of.
The roles most exposed in this layer share one characteristic: their principal output is a completed digital transaction.
| Restaurant or foodservice function | Work an agent could perform | Likely outcome |
|---|---|---|
| Telephone and drive-through order taker | Interpret menu requests, enter orders, confirm details | Dedicated order-taking positions removed at adopting locations |
| Schedule preparation | Build rosters from availability, demand, and labor rules | Folded into a manager’s oversight duties |
| Invoice processing | Match invoices to orders and receiving records, flag discrepancies | Routine processing absorbed; disputes stay with people |
| Catering and reservation coordination | Gather requirements, check availability, prepare standard documents | Routine coordination consolidated |
| Order-status and guest inquiries | Answer standard questions, start permitted corrections | First-line contacts shift to agents; complaints stay human |
| Recurring reporting | Compile sales, inventory, and cost reports | Report assembly largely automated |
Roles that combine these transactions with negotiation, physical inspection, staff leadership, or difficult guest service are more likely to be redesigned than eliminated.
Layer Three: Purchasing and Distribution
The third layer reaches upstream, into how a restaurant buys.
McKinsey’s procurement analysis projects that agentic systems could make procurement functions 25 to 40 percent more efficient. The same research reports that spending managed per full-time procurement employee is already 50 percent higher than five years ago. That historical increase is not attributed to agents.
For restaurants, the most consequential change sits with the distributor. A distributor can connect order intake, inventory checks, approved purchasing, delivery updates, and invoice reconciliation into one system. When those steps run together, automation removes handoffs rather than speeding up one employee’s task.
That process is already underway. Order portals, automated substitutions, and centralized logistics have changed the relationships that once ran through a sales representative and a driver, as examined in IMFounder’s coverage of Sysco’s distribution strategy. The physical layer is being rebuilt on its own track, as covered in Ghost Trucks: Inside America’s Driverless Food Distribution Network.
Agents carry the same operating model into the paperwork that moves alongside the freight.
Layer Four: Consolidation
The fourth layer is where automation becomes a staffing decision.
The math is not one-to-one. Suppose a team’s output per hour rises by 25 percent. If the workload stays the same, the team needs 80 percent of its previous hours. That is a 20 percent reduction in labor time, not 25.
The same logic applies to a single function. Take a restaurant group whose office staff spends 40 percent of its time on administration that could be automated. If agents remove half of that, the gross saving equals 20 percent of total hours. Supervision, review, and unresolved exceptions reduce the net figure.
Employers are planning for reductions regardless. The World Economic Forum’s Future of Jobs Report 2025 found that 41 percent of employers planned to reduce their workforce as AI automates certain tasks. That figure measures stated intent, not jobs lost.
The likely mechanism is consolidation. One manager supervises transactions that used to occupy several people, and a centralized team serves more locations. That pattern could reduce hiring before it produces visible layoffs.
The International Labour Organization’s 2025 assessment, Generative AI and Jobs: A Refined Global Index of Occupational Exposure, found that about one in four workers worldwide holds an occupation with some exposure to generative AI. 3.3 percent of global employment falls into the highest exposure category. Clerical work is the most exposed, and the ILO identifies transformation, not elimination, as the most likely overall outcome.
Layer Five: What Remains
The final layer is the work that stays with people.
BLS projects restaurant cook employment to grow 12.1 percent and fast-food and counter worker employment 5.8 percent from 2025 to 2035. Both rank among the occupations with the most projected job growth.
An agent can process information. It cannot receive ingredients, inspect freshness, prevent cross-contact, or cook and plate a meal.
The likely result is a restaurant divided along that line. Software completes the transactions. People do the physical work and carry the judgment: preparing food, managing safety, leading staff, resolving unusual problems, and delivering service that guests choose because a person provides it.
Administrative duties inside those jobs can still shrink. A manager spends less time building schedules and more time overseeing automated processes. A chef spends fewer hours on proposals, shopping lists, and cost calculations. A purchasing lead handles fewer routine orders and carries more responsibility for supplier performance and disruption.
A Five-Year Outlook
The following outlook through 2031 is this article’s analysis, not a published projection. The BLS figures cited above run through 2035, and the National Restaurant Association forecast covers 2026.
By 2031, operators running integrated ordering, purchasing, accounting, and scheduling systems could operate with fewer positions dedicated solely to processing routine transactions. Order taking, schedule preparation, and invoice processing are the most likely of these. Kitchen and service employment would continue to follow demand.
That outcome assumes three conditions: reliable integrations, accurate records, and controlled authority for agents to execute transactions. Current adoption data shows how far most businesses remain from that point.
The Gap Between Potential and Practice
The evidence on productivity is uneven.
A study of 5,172 customer-support agents published in the Quarterly Journal of Economics found that AI assistance raised issues resolved per hour by 15 percent on average. Less experienced workers improved in both speed and quality. The most experienced saw small speed gains and small declines in quality.
A Harvard Business School field experiment found that consultants completed 12.2 percent more tasks, 25.1 percent faster, on work within AI’s capabilities.
A METR randomized study found that experienced developers using early-2025 tools took 19 percent longer to finish their work.
These studies measure assistance, not autonomy. A faster employee does not establish that an agent can replace that employee.
Deployment also trails the projections. In McKinsey’s 2026 European grocery CEO survey, only 8 percent of CEOs reported established agentic AI use cases, and no organization had scaled agents across functions. Seventy percent reported no measurable EBIT impact from AI or said it was too early to tell.
The same research notes that the simple tasks were automated years ago. What remains is fragmented, heavy with exceptions, and spread across systems. Capturing the full automation potential could require thousands of agents.
Narrow tasks are easier to automate reliably, but narrow scope alone does not guarantee results. Agents still need accurate records, defined permissions, and a process for handling exceptions. The productivity figure that matters is correctly completed work after review and correction are counted.
Who Captures the Gain
The exposure is similar for every operator. The outcome is not.
For an independent restaurant, agents can return hours to an owner who currently does the books, the schedule, and the ordering at night. That same owner pays subscription fees, setup costs, and the time still needed to review exceptions.
For a large chain or distributor, agents spread integration costs across enormous transaction volumes. They let a smaller central team control more locations, suppliers, and data. IMFounder’s coverage of data and platforms in the food supply examines what it means to own the systems those transactions run through.
The evidence points toward a restaurant industry that still employs millions of people to cook and serve, while requiring fewer administrative hours per transaction to coordinate that work. Each saved hour then requires a decision: higher output, better conditions, fewer employees, or heavier workloads for those who remain.
The kitchen is not where agents are most likely to replace people first. The paperwork around it is.
Sources
- National Restaurant Association, 2026 State of the Restaurant Industry press release, February 12, 2026.
- Yum! Brands, NVIDIA collaboration announcement, Form 8-K exhibit, March 18, 2025.
- U.S. Bureau of Labor Statistics, Occupational Outlook Handbook: Waiters and Waitresses.
- McKinsey & Company and EuroCommerce, The State of Grocery Retail Europe 2026.
- U.S. Bureau of Labor Statistics, Occupations with the Largest Job Declines, 2025–35.
- U.S. Bureau of Labor Statistics, Fastest Declining Occupations, 2025–35.
- McKinsey & Company, Transforming Procurement Functions for an AI-Driven World.
- World Economic Forum, Future of Jobs Report 2025.
- International Labour Organization, Generative AI and Jobs: A Refined Global Index of Occupational Exposure, 2025.
- U.S. Bureau of Labor Statistics, Occupations with the Most Job Growth, 2025–35.
- Brynjolfsson, Li, and Raymond, “Generative AI at Work,” Quarterly Journal of Economics, 2025.
- Dell’Acqua et al., “Navigating the Jagged Technological Frontier,” Harvard Business School Working Paper 24-013.
- METR, “Measuring the Impact of Early-2025 AI on Experienced Open-Source Developer Productivity,” July 2025.
Related Articles on IMFounder
- Ghost Trucks: Inside America’s Driverless Food Distribution Network
- How Sysco Corporation Consolidated the Middle Layer of Food Distribution
- Data Is the New Crop: How Big Tech Is Quietly Taking Control of the Food Supply
- The Largest Catering Companies in Sports Are Quietly Replacing Their Own Workforce With AI Inside Taxpayer Stadiums